Confluence 图表宏
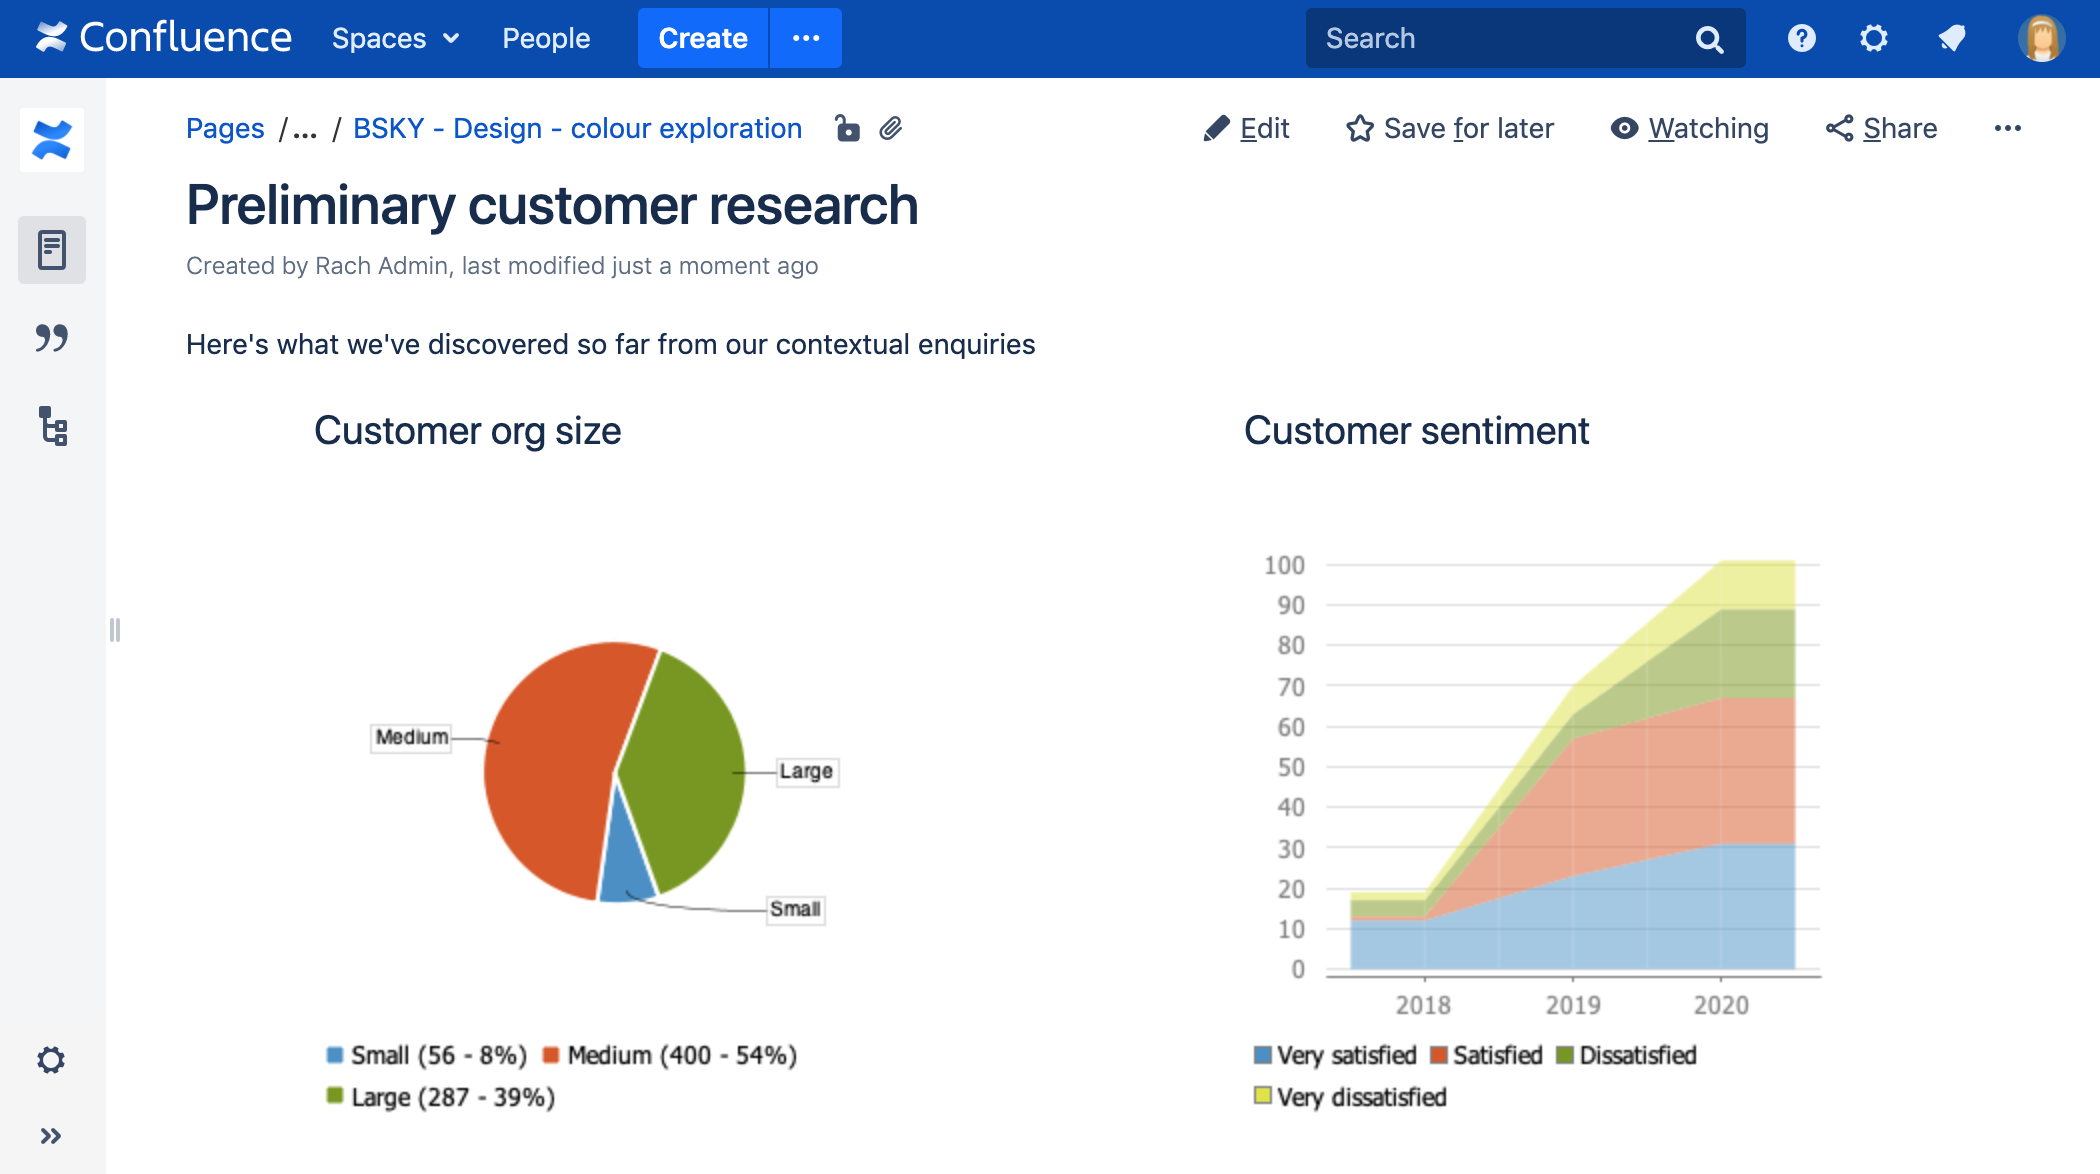
将图表宏添加到页面,可以显示基于同一页面上表格中的数据或来自附件数据的图表。
这非常适合在页面上将数据简单地可视化。
截图:带有两个图表宏的页面
想要在您的页面上显示来自Jira的信息? 请查看Confluence Jira图表宏。
在页面中添加Chart宏
在页面中添加Chart宏:
- 从编辑器工具栏中,选择插入(Insert)
 > 其它宏(Other Macros)。
 - 从Visuals and images类别中选择Chart。
- 点击Insert。
- 在宏的正文中以一张或多张表格的形式输入图表原始数据。有关更多信息,请参阅本页面后面的示例。
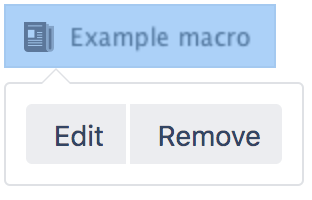
- 点击宏占位符并选择Edit。
- 使用Type参数选择图表类型(见下文)。
- 在宏浏览器中选择其它参数设置,详见下文。
- 点击“预览”区域中的Refresh,检查图表是否按预期显示。
- 点击Save将图表添加到您的页面。
然后,您可以发布您的页面以查看宏的效果。
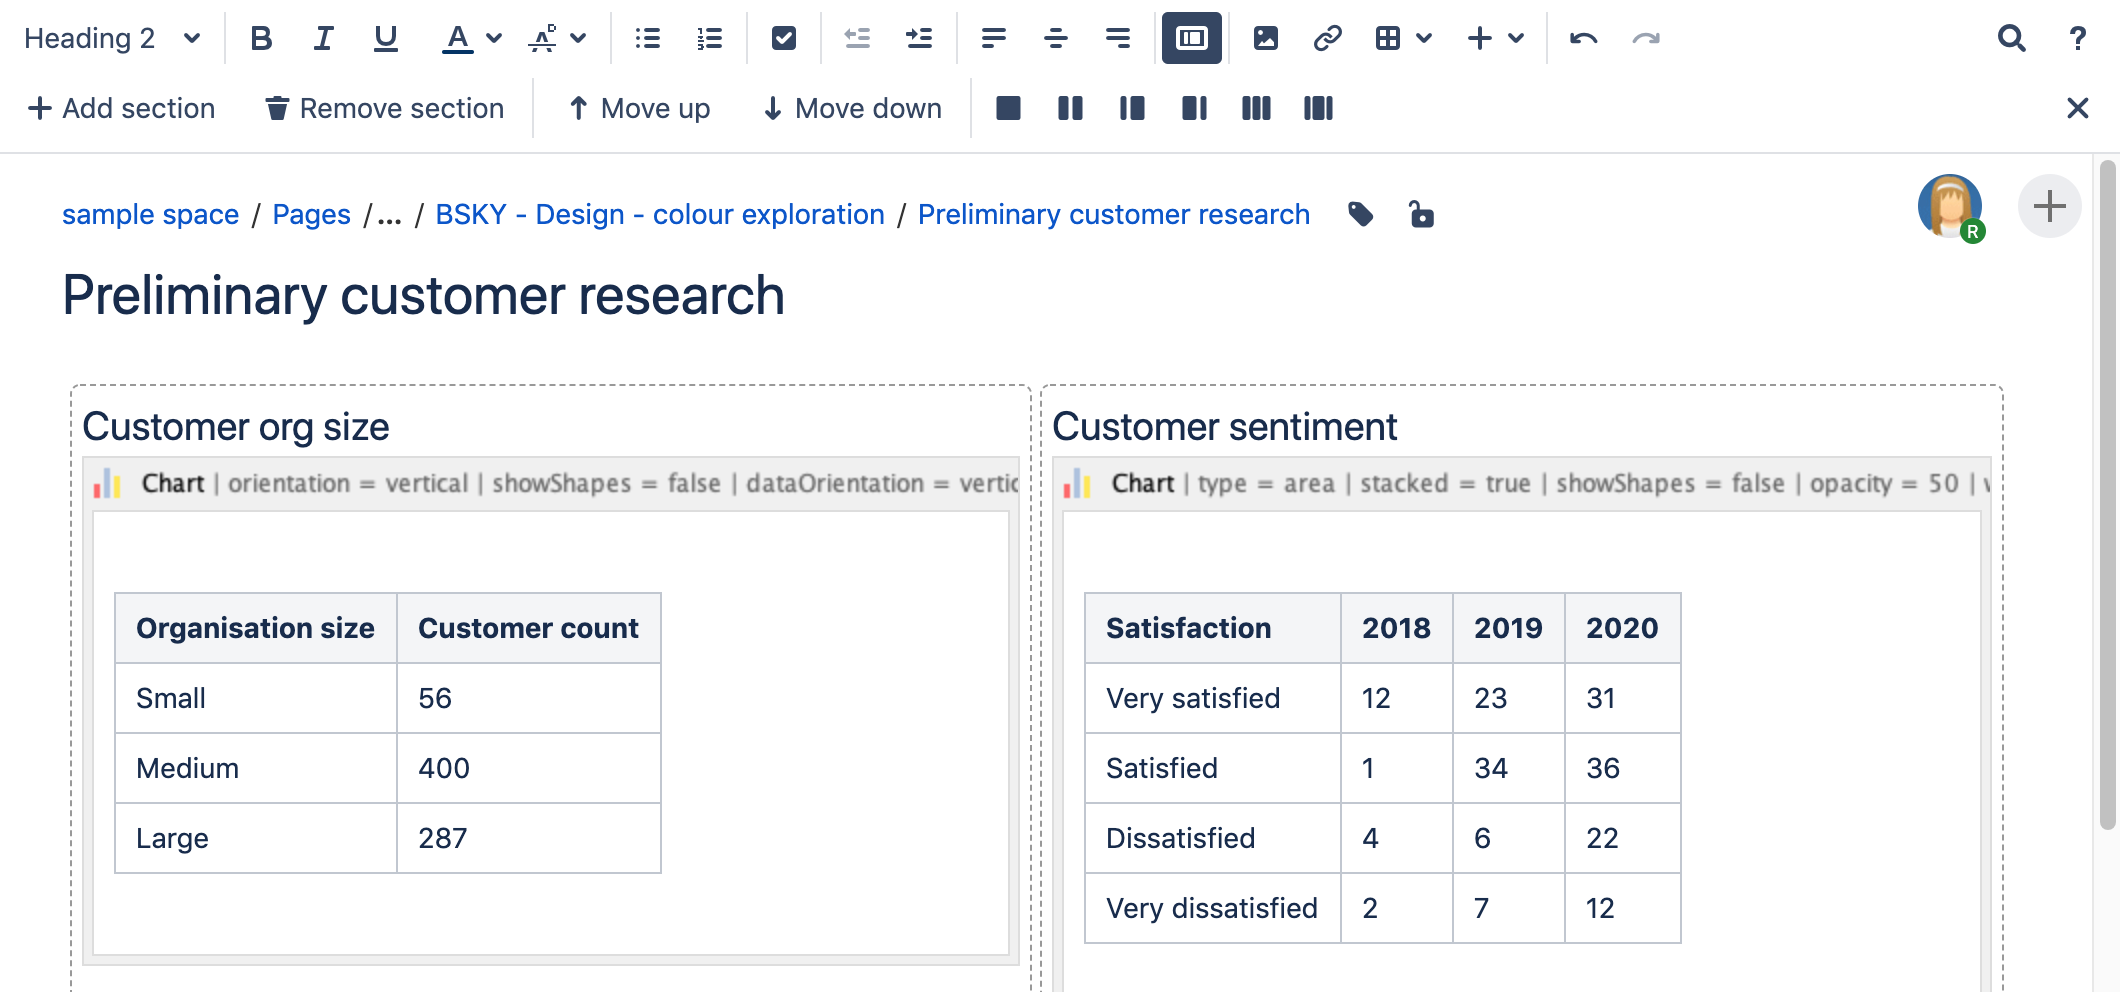
截图:编辑器中的两个图表宏,包含饼图和面积图的数据。
修改宏参数
宏参数用于设置宏的行为。
要更改宏参数:
- 在编辑器中,点击宏占位符并选择“编辑(Edit)”。
- 根据需要设置参数,然后选择“插入(Insert)”。
这是此宏中可用的参数列表。
图表类型参数
这些参数决定了要显示的图表类型和图表的外观。

| 参数 | 默认值 | 描述 |
|---|---|---|
| Type | pie | 要显示的图表类型。XY类图表具有x轴和y轴。 x值可以是基于时间的(请参阅Time Series参数)。 标准类 — 饼图,柱状条,折线图,面积图 XY类 — xy面积图,xy柱状图,xy折线图,xy阶梯图,xy阶梯面积图, 散点图,, 时序图 其它类 — 甘特图 |
| Display Orientation | vertical | 适用于面积图、柱状图和折线图。
|
| Show in 3D | false | 适用于面积图、柱状图和折线图。 |
| Stacked Values | false | 适用于面积图和柱状图。 |
| Show shapes | true | 适用于折线图。形状显示在每个数据点。 |
| Opacity |
| 介于 0(透明)和 100(不透明)之间的百分比值,用于确定面积图和柱状图中重叠展示时的透明程度。 |
展示控制参数
| 参数 | 默认值 | 参数 |
|---|---|---|
| Width | 300 | 图表的宽度(以像素为单位)。最大宽度受 |
| Height | 300 | 图表的高度(以像素为单位)。最大高度受 |
| Display rendered data | false | 设置是否显示宏的渲染正文(通常是原始数据表)。默认情况下,不呈现原始数据表。
|
| Image format | png | 用于图表的格式。
|
标题和标签参数
| 参数 | 默认值 | 描述 |
|---|---|---|
| Chart Title | none | 图表的标题。 |
| Chart Subtitle | none | 图表的副标题,使用比Title更小的字体。 |
| Horizontal-axis Label | none | x 轴(定义域)的标签。 |
| Vertical-axis Label | none | y 轴(值域)的标签。 |
| Show Legend | true | 显示图例或关键字。 |
数据提取参数
图表的数据取自宏正文中的表格。这些选项控制如何转换此数据。默认情况下,根据Confluence全局默认语言(区域设置)格式匹配数字和日期值。如果转换失败,将尝试在Confluence中定义的其它语言。可以使用以下参数指定其它转换选项。
| 参数 | 默认值 | 描述 |
|---|---|---|
| Tables | all first level tables | 包含在宏正文中的表格ID或表格编号(从 1 开始)的逗号分隔列表,将用作图表的原始数据。如果数据表嵌入到其它表中,则需要选择表。用到更复杂的格式时(例如使用section和column宏),就会发生这种情况。 |
| Columns | all columns | 原始数据表格中的列标签,或列标题,或列编号的逗号分隔列表。这适用于处理所有的表。列编号从1开始。列标签是标题行中列的文本。列标题是标题行中列的 (html) 标题属性。 |
| Content Orientation | horizontal |
|
| Time Series | false |
|
| Date format | Confluence language defined date formats | 对于时间序列数据,日期格式允许额外自定义数据到日期的转换格式。如果指定了Date format,它将是用于转换日期值的第一种格式。指定与时间序列数据匹配的格式。请参阅simple date format。 |
| Time Period | Day | 时间序列数据的周期。定义如何解释数据的粒度。有效值为:Millisecond、Second、Minute、Hour、Day、Week、Month、Quarter、Year。 |
| Language | none | 与Country参数结合使用以形成语言环境。这些额外的数字和日期格式将在默认语言之前用于数据转换。 有效值为2个字符的ISO 639-1 alpha-2 codes代码。例如:zh表示中文 |
| Country | none | 与Language参数结合使用以形成语言环境。有效值为 2 个字符的ISO 3166 codes代码。例如:CN表示China |
| Forgive | true |
|
颜色参数
颜色是使用十六进制表示法或HTML颜色名称指定的。
| 参数 | 默认值 | 描述 |
|---|---|---|
| Background Color | White | 图表的背景颜色。 |
| Border Color | no border | 图表周围的边框颜色。 |
| Colors | 逗号分隔的颜色列表,用于自定义类别、区域或维度颜色。 |
轴参数
根据图表类型,可以自定义值域轴和定义域轴。这些值是根据数据自动生成的,但可以通过指定一个或多个这些参数来重写。
| Parameter | Default | Description |
|---|---|---|
| Range Minimum Value | none | 值域轴下限。 |
| Range Maximum Value | none | 值域轴上限。 |
| Range Axis Tick Unit | none | 值域轴刻度线的单位。 |
| Range Axis Label Angle | none | 值域轴标签的角度,以度为单位。 |
| Domain Axis Lower Bound | none | 仅适用于XY类图。定义域轴下限。对于日期轴,此值必须以Date format参数指定的日期格式表示。 |
| Domain Axis Upper Bound | none | 仅适用于XY类图。定义域轴上限。对于日期轴,此值必须以Date format参数指定的日期格式表示。 |
| Domain Axis Tick Unit | none | 仅适用于XY类图。定义域轴刻度线的单位。对于日期轴,此值表示Time Period参数中指定的单位计数。可以通过指定尾随字符来覆盖Time Period单位:y(年)、M(月)、d(天)、h(小时)、m(分钟)、s(秒)、u(毫秒)。 |
| Domain Axis Label Angle | none | 仅适用于XY类图。定义域轴标签的角度,以度为单位。 |
| Category Label Position | 类别的轴标签文本的放置方式。
| |
| Date Tick Mark Position | start | 日期刻度线的位置。
|
饼图参数
| 参数 | 默认值 | 描述 |
|---|---|---|
| Pie Section Label | Show only the pie section key value | 饼图部分标签的显示格式。该格式使用带有特殊替换变量的字符串:
示例 1:“%0% = %1%”将显示为“Independent = 30”形式的内容 |
| Pie Section Explode | No exploded sections | 逗号分隔的饼图关键字列表,将突出显示。 注意:需要 jFreeChart 1.0.3 或更高版本。 |
附件参数
这些是可用于图表版本控制、启用自动化和提高性能的高级选项。小心使用这些选项!通常,每次显示页面时都会重新生成图表。这些选项允许将生成的图像另存为附件,并在随后的访问中重新使用该附件。 这在与缓存插件结合以提高性能时尤其有用。根据选择的选项,图表可以出于历史追溯目的进行版本控制。
| 参数 | 默认值 | 描述 |
|---|---|---|
| Attachment | none | 图表将保存为附件的名称和位置。用户必须有权将附件添加到指定的页面。
|
| Attachment Version | new | Defines the the versioning mechanism for saved charts. 定义图表附件的版本控制机制。 new — 创建附件的新版本。
|
| Attachment Comment | none | 用于图表附件的注释。 |
| Thumbnail | false |
|
饼图
这是饼图的示例。

要创建此图表,我们在宏浏览器中设置这些参数:
- Type: pie
- Chart title: Fish sold in 2011
- Show legend: true
- Content orientation: vertical
并在宏正文中添加此数据表:
Fish Type | 2011 |
|---|---|
Herring | 9,500 |
Salmon | 2,900 |
Tuna | 1,500 |
柱状图
这是柱状图示例。

要创建此图表,我们在宏浏览器中设置这些参数:
- Type: bar
- Chart title: Fish sold
- Show legend: True
并在宏正文中添加此数据表:
Fish Type | 2010 | 2011 |
|---|---|---|
Herring | 9,500 | 8,300 |
Salmon | 2,900 | 4,200 |
Tuna | 1,500 | 1,500 |
3D柱状图
这是3D柱状图的示例。

要创建此图表,我们在宏浏览器中设置这些参数:
- Type: bar
- Show in 3D: true
- Opacity: 50
- Show legend: true
并在宏正文中添加此数据表:
2009 | 2010 | 2011 |
|---|---|---|
Revenue | 12.4 | 31.8 |
Expense | 43.6 | 41.8 |
时序图
这是时序图的示例。

要创建此图表,我们在宏浏览器中设置这些参数:
- Type: Time series
- Date format: MM/yyyy
- Time period: Month
- Content orientation: vertical
- Range axis lower bound: 0
- Show legend: true
并在宏正文中添加2个数据表:
Month | Revenue |
|---|---|
1/2011 | 31.8 |
2/2011 | 41.8 |
3/2011 | 51.3 |
4/2011 | 33.8 |
5/2011 | 27.6 |
6/2011 | 49.8 |
7/2011 | 51.8 |
8/2011 | 77.3 |
9/2011 | 73.8 |
10/2011 | 97.6 |
11/2011 | 101.2 |
12/2011 | 113.7 |
Month | Expenses |
|---|---|
1/2011 | 41.1 |
2/2011 | 43.8 |
3/2011 | 45.3 |
4/2011 | 45.0 |
5/2011 | 44.6 |
6/2011 | 43.8 |
7/2011 | 51.8 |
8/2011 | 52.3 |
9/2011 | 53.8 |
10/2011 | 55.6 |
11/2011 | 61.2 |
12/2011 | 63.7 |
XY折线图
这是XY折线图的示例。

要创建此图表,我们在宏浏览器中设置这些参数:
- Type: xyLine
- Show legend: true
并在宏正文中添加此数据表:
12 | 14 | 23 | |
|---|---|---|---|
Revenue | 41.1 | 31.8 | 12.4 |
Expense | 31.1 | 41.8 | 43.6 |
XY面积图
这是XY面积图的示例。

要创建此图表,我们在宏浏览器中设置这些参数:
- Type: xyArea
- Show legend: true
并在宏正文中添加此数据表:
12 | 14 | 23 | |
|---|---|---|---|
Revenue | 41.1 | 31.8 | 12.4 |
Expense | 31.1 | 41.8 | 43.6 |
面积图
这是面积图的示例。

要创建此图表,我们在宏浏览器中设置这些参数:
- Type: area
- Show legend: true
- Width: 300
- Height: 300
- Opacity: 50
并在宏正文中添加此数据表:
Satisfaction | 2009 | 2010 | 2011 |
|---|---|---|---|
Very satisfied | 20 | 23 | 34 |
Satisfied | 40 | 34 | 23 |
Dissatisfied | 25 | 26 | 25 |
Very dissatisfied | 15 | 17 | 18 |
堆积面积图
这是堆积面积图的示例。

要创建此图表,我们在宏浏览器中设置这些参数:
- Type: area
- Show legend: true
- Width: 300
- Height: 300
- Stacked values: true
并在宏正文中添加此数据表:
Satisfaction | 2009 | 2010 | 2011 |
|---|---|---|---|
Very satisfied | 12 | 23 | 31 |
Satisfied | 1 | 34 | 36 |
Dissatisfied | 4 | 6 | 22 |
Very dissatisfied | 2 | 7 | 12 |
甘特图
这是甘特图的示例。

要创建此图表,我们在宏浏览器中设置这些参数:
- Type: gantt
- Width: 300
- Height: 200
- Columns: ,,1,2,3,4 (
 必须以两个逗号开始)
 - Date format: MM/dd/yyyy
并在宏正文中添加2个数据表:
| Plan | Start | End | Status |
|---|---|---|---|
| Stage 1 | 6/25/2013 | 7/10/2013 | 30% |
| Stage 2 | 7/13/2013 | 11/28/2013 | 40% |
| Stage 3 | 12/1/2013 | 12/25/2013 |
| Actual | Start | End | Status |
|---|---|---|---|
| Stage 1 | 6/25/2013 | 7/26/2013 | 100% |
| Stage 2 | 7/29/2013 | 12/01/2013 | 40% |
| Stage 3 | 12/10/2013 | 12/25/2013 |
其它添加方式
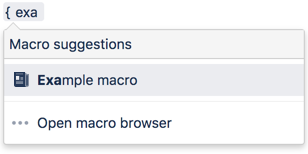
用键盘输入添加宏
通过wiki标记添加宏
当您想在编辑器之外添加宏时,这非常有用。例如作为侧边栏、空间页眉或页脚中的自定义内容。
Macro name: chart
Macro body: 支持富文本,由包含图表数据的表格组成。
下面是饼图的简单示例。详见Wiki Markup Examples for Chart Macro。
{chart:type=pie|title=Fish Sold}|| Fish Type || 2004 || 2005 |||| Herring | 9,500 | 8,300 ||| Salmon | 2,900 | 4,200 ||| Tuna | 1,500 | 1,500 |{chart}此宏可识别大量参数,在此按类型列出。
Chart type parameters
These parameters determine the type of chart to display and how the chart looks.
| Parameter | Required | Default | Description |
|---|---|---|---|
type | No | pie | The type of chart to display. XY charts have numerical x- and y-axes. The x values may optionally be time-based. See the Available values:
|
orientation | No | vertical | The display orientation. Applies to area, bar and line charts. Available values:
|
3D | No | false | Show in three dimensions. Applies to area, bar and line charts. |
stacked | No | false | Stacked values. Applies to area and bar charts. |
showShapes | No | true | Applies to line charts. Shapes are shown at each data point. |
opacity | No |
| A percentage value between 0 (transparent) and 100 (opaque) that determines how opaque the foreground areas and bars are. |
Chart display parameters
| Parameter | Required | Default | Description |
|---|---|---|---|
width | No | 300 | The width of the chart in pixels. |
height | No | 300 | The height of the chart in pixels. |
dataDisplay | No | false | Determines whether to display the body of the macro, consisting of the data table. By default, the chart data table is not displayed. Available values:
|
imageFormat | No | png | The image format to be used for the chart. Available values:
|
Chart title and label parameters
| Parameter | Required | Default | Description |
|---|---|---|---|
title | No | (None) | The title of the chart. |
subTitle | No | (None) | A subtitle for the chart. |
xLabel | No | (None) | The label for the x-axis (domain). |
yLabel | No | (None) | The label for the y-axis (range). |
legend | No | false | Determines whether to show a legend (key) for the chart. |
Chart data parameters
The data for the chart is taken from tables found in the macro body. The parameters below control how this data is interpreted. By default, numeric and date values are interpreted according to the Confluence global default language (locale) formats. If conversion fails, other languages defined in Confluence will be tried. You can specify additional conversion options using the parameters below.
| Parameter | Required | Default | Description |
|---|---|---|---|
tables | No | All first level tables | You can supply a comma-separated list of table IDs and/or table numbers (starting at 1) contained within the body of the macro that will be used as the data for the chart. If data tables are embedded in other tables, then table selection will be required. This occurs when more complex formatting is done (for example using section and column macros). |
columns | No | All columns | You can supply a comma-separated list of column labels and/or column titles and/or column numbers for tables used for chart data. This applies to all tables processed. Columns are enumerated starting at 1. Column label is the text for the column in the header row. Column title is the HTML title attribute for the column in the header row. |
dataOrientation | No | horizontal | The content orientation. By default, the data tables will be interpreted as columns (horizontally) representing domain and x values. Available values:
|
timeSeries | No | false | If ' |
dateFormat | No | Confluence language defined date formats | For time series data, the date format allows for additional customization of the conversion of data to date values. If a dateFormat is specified, it will be the first format used to interpret date values. Specify a format that matches the time series data. See simple date format. |
timePeriod | No | day | The time period for time series data. Defines the granularity of how the data is interpreted. Available values: |
language | No | (None) | Use in combination with the Available values are the two-character ISO 639-1 alpha-2 codes. |
country | No | (None) | Use in combination with the language parameter to form a locale. Valid values are the two-character ISO 3166 codes. |
forgive | No | true | Determines whether the macro will forgive (allow) some data formatting errors. Available values:
|
Chart color parameters
Colors are specified using hexadecimal notation or HTML color names.
| Parameter | Required | Default | Description |
|---|---|---|---|
bgColor | No | White | Background color of the chart. |
borderColor | No | No border | Color of the border around the chart. |
colors | No | A comma-separated list of colors used to customize the colors of categories, sections, and series. |
Chart axis parameters
Depending on the chart type, the range and domain axis may be customized. These values are automatically generated based on the data but can be overridden by specifying one or more more of these parameters.
| Parameter | Required | Default | Description |
|---|---|---|---|
rangeAxisLowerBound | No | (None) | Minimum value for the range axis. |
rangeAxisUpperBound | No | (None) | Maximum value for the range axis. |
rangeAxisTickUnit | No | (None) | Range axis units between axis tick marks. |
rangeAxisLabelAngle | No | (None) | Angle for the range axis label in degrees. |
domainAxisLowerBound | No | (None) | Only applies to XY plots. Domain axis lower bound. For a date axis, this value must be expressed in the date format specified by the dateFormat parameter. |
domainAxisUpperBound | No | (None) | Only applies to XY plots. Domain axis upper bound. For a date axis, this value must be expressed in the date format specified by the dateFormat parameter. |
domainAxisTickUnit | No | (None) | Only applies to XY plots. Domain axis units between axis tick marks. For a date axis, this value represents a count of the units specified in the timePeriod parameter. The timePeriod unit can be overridden by specifying a trailing character: y (years), M (months), d (days), h (hours), m (minutes), s (seconds), u (milliseconds). |
domainAxisLabelAngle | No | (None) | Only applies to XY plots. The angle for the domain axis label, in degrees. |
categoryLabelPosition | No | (None) | Placement of the axis label text for categories. Available values:
|
dateTickMarkPosition | No | start | Placement of the date tick mark. Available values:
|
Pie chart Parameters
| Parameter | Required | Default | Description |
|---|---|---|---|
pieSectionLabel | No | Show only the pie section key value | Formatof pie section labels. The format uses a string with special replacement variables:
Example 1: To display something like 'Independent = 20': %0% = %1%
%0% (%2%) |
pieSectionExplode | No | No exploded sections | A comma-separated list of pie keys that are to be shown exploded. Note: requires jFreeChart version 1.0.3 or higher. |
Chart attachment parameters
These are advanced options that can be used for chart versioning, to enable automation and to improve performance. Use these options carefully! Normally, the chart image is regenerated each time the page is displayed. These options allow for the generated image to be saved as an attachment and have subsequent access to re-use the attachment. This can be useful especially when combined with the Cache plugin to improve performance. Depending on the options chosen, chart images can be versioned for historical purposes.
| Parameter | Required | Default | Description |
|---|---|---|---|
attachment | No | (None) | The name and location where the chart image will be saved as an attachment. The user must be authorized to add attachments to the page specified. Available syntax for this parameter:
|
attachmentVersion | No | new | Defines the the versioning mechanism for saved charts. Available values:
|
attachmentComment | No | (None) | Comment used for a saved chart attachment. |
thumbnail | No | false | If |